Climate Price - Methodology
Overview
Corporate climate disclosures (TCFD, ISSB / IFRS S2, and sustainability reports) are written to meet reporting rules and rarely give investors actionable estimates of financial loss from physical risk. In the IFRS Foundation's Progress on Corporate Climate-related Disclosures review of 3,814 public companies for the Financial Stability Board, only 2% to 3% reported across all 11 TCFD disclosures and 11% disclosed scenario resilience, which the Foundation noted hinders investors' ability to assess and price climate risk. A 2025 study by UBS Asset Management, Nest, and the Oxford Sustainable Finance Group (Harnessing Climate Data) reached the same conclusion on physical risk, describing corporate reporting as "limited, incomplete and inadequate." Even where figures are published, reporting standards let companies choose their own scenarios, hazard thresholds, and boundaries, often pricing only selected plants while leaving out chronic operating costs and supply chains. Those gaps and differences in method make self-reported figures difficult to compare across a portfolio or use to guide investment decisions.
Climate Price solves this problem by estimating EBITDA-at-Risk, the share of a company's annual EBITDA exposed to physical climate risk, on a standardised bottom-up basis across listed issuers, private companies, and subsidiaries. It maps each company's operating sites and financial cost base from public disclosures and asset registries, evaluates each site using AlphaGeo's site-level Financial Impact Analytics (FIA) metrics, and aggregates the results to the company and portfolio level. Because the calculation never uses a company's self-assessed risk view as an input, investors get explainability across individual sites and P&L channels, source traceability for every location and cost figure, and consistent peer benchmarking within each sector.
The calculation runs in two stages:
- Asset and financials mapping. Collect the company's operating sites, financial cost base, regional asset split, and upstream input dependencies from disclosures and registries.
- Impact assessment and aggregation. Evaluate each priced site across FIA channels, convert those site-level impacts into a share of company EBITDA using the company's P&L structure, weight sites by regional assets, and add upstream supply-chain cost pass-through.
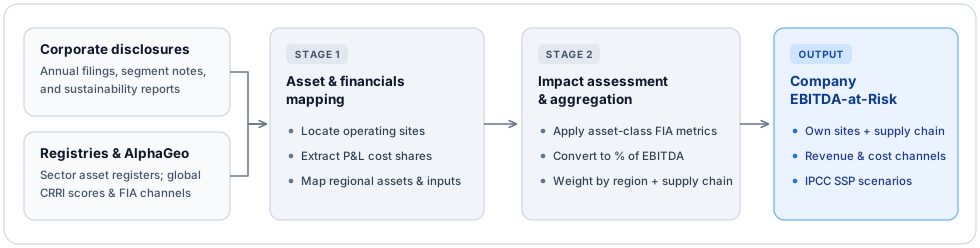
EBITDA-at-Risk measures the percentage of annual EBITDA lost in an average year over the modelled hold period, computed across IPCC SSP climate scenarios (such as SSP2-4.5, SSP3-7.0, and SSP5-8.5) and displayed as a low-to-high scenario range around a central case (SSP3-7.0). Each scenario figure also carries a separate data-quality sensitivity band reflecting footprint coverage and location precision, distinct from a statistical confidence interval. Results break down into own-site impacts (revenue and operating-cost channels) plus supply-chain pass-through, alongside annual loss in USD where a verified positive EBITDA baseline and currency conversion exist, and a percentile ranking against covered peers in the same GICS sector.
AlphaGeo data layers
Climate Price reads AlphaGeo's global datasets for each priced site:
| Layer | Role in Climate Price |
|---|---|
| Climate Risk and Resilience Index (CRRI) | Hazard severity scores (0 to 100, higher is worse) across acute and chronic perils (such as heat, inland flood, coastal flood, wind, wildfire, drought, hail, landslide, and earthquake), shown per site and as a site-weighted company mean. Provides physical hazard context and does not enter the EBITDA formula. |
| Financial Impact Analytics (FIA) | Resilience-adjusted site-level financial metrics across revenue and operating-cost channels (such as operational downtime, operational efficiency, workforce productivity, insurance premiums, utility demand, and maintenance costs). These metrics drive EBITDA-at-Risk. |
See Climate Risk and Resilience Index - Methodology and Financial Impact Analytics - Methodology for how each dataset is built.
Stage 1: Asset and financials mapping
Source categories and operating sites
Climate Price builds each company's consolidated operating footprint and financial profile from public disclosure and registry sources:
| Source category | Typical disclosures | What Climate Price takes from it |
|---|---|---|
| Official financial filings | Annual and periodic reports (such as 10-K, 20-F, and statutory annual reports), segment and geographic notes | Revenue, EBITDA, operating expense lines, regional asset splits, core properties, and historical weather losses |
| Corporate and climate disclosures | Sustainability and climate reports, CDP responses, corporate reporting hubs and location pages | Operating facility locations and upstream commodity sourcing geographies |
| Regulatory and sector registries | National and sector-specific energy, industrial, and infrastructure asset registers | Verified facility locations, facility types, and operator affiliations |
Divested businesses, non-operated minority stakes, and duplicate site records across sources are excluded, and operational affiliation is recorded separately from asset ownership. When a filing discloses an aggregate facility count (for example, "150 facilities across 20 countries") without naming every site, that figure is retained to measure footprint coverage.
Sites are resolved to exact site or street locations where available and to city-level locations otherwise. City-level resolution is the minimum required to assign site FIA data (carrying a wider data-quality sensitivity band than exact site addresses). Broad state- or country-only mentions count toward disclosed site totals without being priced, and unverified records or locations without site-level FIA data remain visible as unavailable with zero weight.
Financial cost base and currency treatment
To translate site-level FIA metrics into EBITDA impact, Climate Price reads the company's financial inputs from a single coherent latest reporting period (trailing twelve months or annual, without mixing periods across operating profit and depreciation and amortisation):
- Revenue and EBITDA (or operating profit plus same-period depreciation and amortisation)
- Own-site share of revenue, set to 100% unless segment disclosures indicate outsourced production
- Insurance, utilities or energy, and repairs and maintenance expenses (or combined premises expenses when not split out)
- Cost of sales or purchased goods, used by the supply-chain overlay
- Long-lived (non-current) assets, total assets, or revenue by country or region from geographic segment notes, used to weight sites
Percentage EBITDA-at-Risk is computed from matching-currency shares of revenue so reporting currency cancels out. Outsourced production carries no own-site output loss; supplier exposure enters through the supply-chain overlay instead. Cost lines omitted from the filings take stated model defaults in Stage 2.
Annual loss in USD is calculated only when the company reports positive EBITDA (or operating profit plus same-period depreciation and amortisation) and a supported FX rate is available; sector-average margins are never used to invent a dollar EBITDA baseline. Where financial inputs are supplied directly by a user (for example on a private company), they are labelled as unverified input scenarios rather than audited figures.
Historical weather-loss disclosures
Filings and sustainability reports occasionally disclose past weather events, their financial impact, and how costs were shared across the company, insurers, and customers. Climate Price displays these verbatim disclosures alongside the modelled figures (keeping gross damages, insurance recoveries, and multi-event totals distinct) as historical context. Reported past events do not enter the EBITDA-at-Risk calculation.
Stage 2: Impact assessment and aggregation
Asset-adjusted site FIA metrics
The same climate hazard affects an industrial plant differently from an office. At each priced site, raw site FIA metrics are multiplied per channel by the coefficients of AlphaGeo's Asset-Specific Vulnerability Framework. Workforce productivity has no asset-class coefficient in that framework and is applied unweighted.
| Channel | Site FIA metric | Base applied to |
|---|---|---|
| Operational downtime | Additional days offline per year | Own-site output |
| Operational efficiency | Share of capacity lost | Own-site output |
| Workforce productivity | Share of labour output lost | Own-site output |
| Insurance | Compound annual premium growth | Insurance expense |
| Utility | Cooling and heating cost increase | Utilities expense |
| Maintenance | Repairs and maintenance cost increase | Maintenance expense |
Each facility type maps to an FIA asset class:
| Facility types | Asset class |
|---|---|
| Headquarters, office, retail, commercial property, mixed use | Commercial |
| Residential property | Residential |
| Factory / plant, warehouse / distribution, mine / extraction | Industrial |
| Data center | Data Center |
| Power plant | Energy Generation |
| Pipeline / transmission, tower / antenna | Electricity T&D |
| Port / terminal | Seaport |
| Any other site | Other |
Converting site FIA metrics to company EBITDA-at-Risk
Site FIA data expresses physical risk as percentage impacts on output and on individual expense lines rather than directly as a share of EBITDA. Climate Price converts those metrics into company EBITDA-at-Risk using the company's P&L cost structure:
Lower revenue (downtime, efficiency, and workforce productivity). Output channels reduce how much a site produces over the year. With d downtime days per year and fractional efficiency and productivity losses e and p, combined output loss is 1 − (1 − d/365)(1 − e)(1 − p), so a day already lost to shutdown cannot also be lost to lower efficiency. The combined loss is scaled by the share of revenue produced at the company's own sites and attributed proportionally across downtime, efficiency, and productivity in the channel breakdown. Over a 10-year hold, chronic output reductions trim revenue and EBITDA in the same proportion, matching FIA's discounted cash-flow model:
Revenue channel loss (% of EBITDA) = Own-site revenue share × Combined output loss %
Higher operating costs (insurance, utilities, and maintenance). Each forecasted cost increase applies to what the company spends on that expense line (as a % of revenue), then divides by the company's EBITDA margin to convert % of revenue into % of EBITDA. Utility and maintenance increases apply directly to their cost lines; insurance premium growth compounds over the 10-year hold and uses the 10-year average extra premium:
Cost channel loss (% of EBITDA) = (Expense as % of revenue × 10-year forecasted increase %) ÷ EBITDA margin
For example, if utilities equal 3% of revenue and climate adds 12% to cooling demand, the extra bill is 0.36% of revenue. On a 20% EBITDA margin, 0.36% ÷ 20% equals 1.8% of EBITDA.
Total site EBITDA-at-Risk. Summing the revenue loss and the operating-cost losses gives the site's standalone figure, representing what company EBITDA-at-Risk would be if all operations faced that site's climate exposure:
Site EBITDA-at-Risk = Revenue channel loss + Insurance loss + Utility loss + Maintenance loss
Defaults for undisclosed cost lines
When filings omit a required expense line or report a non-positive or unusable EBITDA margin, Climate Price applies a stated fallback and flags it in the profile:
| Input | Primary source | Fallback when undisclosed |
|---|---|---|
| EBITDA margin | Reported EBITDA (or operating profit + same-period D&A) / revenue, within (0%, 100%) | User-supplied margin where provided (flagged as unverified); otherwise GICS sector average (also used when reported margin is non-positive or ≥ 100%) |
| Own-site revenue share | Segment disclosures on internal vs. outsourced production | 100% |
| Insurance | Reported insurance expense | 0.18% of reported long-lived assets; otherwise 3% of revenue |
| Utilities | Reported utilities / energy expense | Share of combined premises cost (after deducting any separate maintenance line); otherwise 3% of revenue |
| Maintenance | Reported repairs and maintenance expense | Share of combined premises cost (after deducting any separate utilities line); otherwise 0.30% of reported long-lived assets, then 5% of revenue |
When a filing reports a combined premises, utilities, and maintenance line, any separately reported utilities or maintenance expense is deducted first and only the remainder is split across the missing component(s) in FIA's 3:5 DCF proportion (flagged as an upper bound because combined premises lines can include rent). The revenue-share fallbacks (3% insurance, 3% utilities, 5% maintenance) come from the standard cost structure of the FIA discounted cash-flow model.
Regional weighting, company roll-up, and portfolio aggregation
Weighting every site equally would give a small sales office the same influence as a major manufacturing plant. Instead, Climate Price weights priced sites by where the company's productive assets sit, dividing each region's share of reported assets equally among the priced sites in that region:
Site weight = Region's share of reported assets ÷ Priced sites in that region
Direct EBITDA-at-Risk = Sum of (Site weight × Site EBITDA-at-Risk)
Climate Price uses regional long-lived assets first, then falls back in order to regional total assets, regional revenue, or equal weights when regional disclosures do not span enough of the priced footprint. Regions with no priced sites are excluded from the denominator, any priced site outside every reported region receives the mean matched weight, and weights rescale to 100%. Channel breakdowns and company-level CRRI Risk Scores use the same site weights across covered sites.
Locations without site-level FIA data or source verification carry zero weight and appear as unavailable in the profile. If a company has no priced sites, its calculation is marked unavailable rather than reported as zero loss.
Across a multi-company portfolio, holdings are weighted equally or by portfolio weights across companies with complete scenario results (excluding pending or unavailable holdings). Portfolio country exposure allocates each company's direct risk across countries in proportion to site weight × site impact under each scenario, while unallocated direct exposure and upstream supply-chain pass-through remain in separate buckets that reconcile to the portfolio total.
Supply-chain overlay
Filings rarely list individual supplier factories, though they often disclose key purchased inputs and sourcing regions. When physical climate risk raises a supplier's operating costs, part of that increase passes through into purchased goods and energy prices. Climate Price estimates each disclosed dependency's impact using the same margin conversion as own-site expenses:
Supply-chain loss (% of EBITDA) = (Purchases as % of revenue × Supplier cost increase %) ÷ EBITDA margin
Company EBITDA-at-Risk = Direct EBITDA-at-Risk + Supply-chain loss
Only operating purchases (materials and dedicated energy purchases from cost of sales or purchased-goods disclosures) are priced. Capital equipment, financing, customer relationships, and own-site energy bills already captured in the FIA Utility channel are excluded so costs are never double-counted. When multiple dependencies share one reported cost-of-sales or purchased-goods line, that line is divided equally across all purchase dependencies on it, including unpriced items, so an unlocated input never inflates the priced ones.
The supplier cost increase applies the sourcing geography's FIA insurance (compounded over 10 years), utility, and maintenance metrics to FIA's standard insurance, utility, and maintenance cost shares. Subnational sourcing locations use local FIA metrics, and sourcing countries use country-average FIA metrics. Naming a supplier or its corporate headquarters does not assign a production location unless the sourcing geography itself is disclosed. Broad scopes such as "global" or multi-country regions ("Europe", "Asia") are never narrowed to a single example country; they are priced only where sustainability or climate disclosures establish specific physical sourcing countries (excluding mass-balance accounting claims), weighted equally across verified countries when sourcing shares are undisclosed.
Worked example
Take a company in one scenario with a 20% EBITDA margin, 100% own-site production, and reported expenses of 0.5% insurance, 3.0% utilities, and 2.0% maintenance (as shares of revenue). It reports long-lived assets of 600 in the United States (60%) and 400 in Europe (40%), with one priced site in each region:
- Site A (US factory, Industrial, 60% weight): asset-adjusted site FIA metrics of 6 downtime days, 1.5% efficiency loss, 1.5% productivity loss, 8.0% annual insurance growth (56.5% average extra premium over 10 years), 12.0% utility cost increase, and 6.0% maintenance cost increase.
- Site B (European office, Commercial, 40% weight): asset-adjusted site FIA metrics of 1 downtime day, 0.2% efficiency loss, 0.5% productivity loss, 2.25% annual insurance growth (13.2% average extra premium over 10 years), 6.0% utility cost increase, and 3.0% maintenance cost increase.
| Channel | Site A calculation | Site A (% EBITDA) | Site B (% EBITDA) | Company (% EBITDA) |
|---|---|---|---|---|
| Revenue channels | 100% own-site revenue × 4.57% combined output loss (6 downtime days, 1.5% efficiency, 1.5% productivity) | 4.57 | 0.97 | 3.13 |
| Insurance | 0.5% insurance cost × 56.5% 10-year forecasted increase ÷ 20% EBITDA margin | 1.41 | 0.33 | 0.98 |
| Utility | 3.0% utility cost × 12.0% 10-year forecasted increase ÷ 20% EBITDA margin | 1.80 | 0.90 | 1.44 |
| Maintenance | 2.0% maintenance cost × 6.0% 10-year forecasted increase ÷ 20% EBITDA margin | 0.60 | 0.30 | 0.48 |
| Direct EBITDA-at-Risk | Sum of channels (company: 60% × 8.38% + 40% × 2.50%) | 8.38 | 2.50 | 6.03 |
Displayed to one decimal place, direct EBITDA-at-Risk is 6.0%, before adding any priced supply-chain pass-through.
Coverage and limitations
Footprint coverage
Combining corporate filings with public asset registers captures plant-level operating footprints even where annual reports summarise operations only by segment or country, particularly in asset-heavy sectors such as utilities, industrials, energy, and digital infrastructure. Because public disclosure depth still varies by issuer, each company profile reports its mapped site count alongside any aggregate facility total stated in filings, the share of sites resolved to exact facility or street locations versus city level, and direct links to the underlying filing or registry record for every priced location and financial line. Together with the data-quality sensitivity band, these indicators show how much of an issuer's physical footprint is directly observed.
Comparison with corporate climate self-reports
Compared with companies' published TCFD, ISSB / IFRS S2, CDP, and resilience self-reports, Climate Price tracks similar physical risk profiles while reporting more complete, standardised quantitative measures. Corporate disclosures generally stop at qualitative hazard lists or physical exposure counts for selected assets, and when financial estimates are published they usually cover only a single business unit or acute property damage. Built independently from site-level data without using company self-assessments as inputs, Climate Price identifies the same underlying hazard patterns and extends them into comparable EBITDA-at-Risk, dollar loss, P&L channel breakdowns, and sector peer rankings:
- Duke Energy (2024 Climate Resilience and Adaptation Study): Duke reports physical exposure shares, including 21% of Carolinas generation and grid assets facing Category 4+ hurricane wind speeds in a 500-year event by 2050, without publishing an earnings figure. Climate Price flags a closely matching share of scored Duke sites for high wind risk and quantifies the resulting EBITDA impact across downtime, insurance, utility, and maintenance channels.
- Olam Group (TCFD and climate disclosures): Olam identifies drought, flood, and heat as its main physical hazards and publishes a financial exposure estimate limited to Tier 1 processing facilities in a single operating group. Climate Price independently ranks those same perils highest while quantifying group-wide EBITDA-at-Risk across own-site operations and agricultural sourcing.
- Enel (CDP and climate disclosures): Enel highlights specific Italian generation plants (such as Rossano and Assemini) as water-stressed; Climate Price independently flags elevated drought risk at those facilities and translates site-level exposure into comparable revenue and operating-cost metrics.
Limitations
- Undisclosed facilities absent from public registries, broad state- or country-only mentions, and locations without site-level FIA data are not priced and appear as unavailable rather than zero risk; companies with no priced sites return an unavailable calculation.
- Facilities are evaluated as discrete locations, so linear networks such as railways, transmission lines, and pipelines are not modelled continuously along their routes.
- Where a company omits insurance, utility, or maintenance expenses or reports an unusable EBITDA margin, FIA model cost-share and sector-margin defaults stand in and are flagged in the profile. Annual USD loss is omitted whenever positive reported EBITDA (or operating profit plus same-period D&A) or currency conversion is unavailable.
- Supply-chain pricing captures chronic operating-cost pass-through on disclosed sourcing geographies; named suppliers without disclosed production locations, mass-balance accounting claims, and acute supplier shutdowns or delivery shortages remain unpriced.